Post Sponsored by RNNR Spotter Trend Algo
RNNR Spotter’s proprietary trend algorithm script uses a combination of indicators and data to generate accurate buy and sell alerts.
Things move fast in the stock market, and so many stocks to watch. Here is our list of five stocks to add to your watchlist this week.
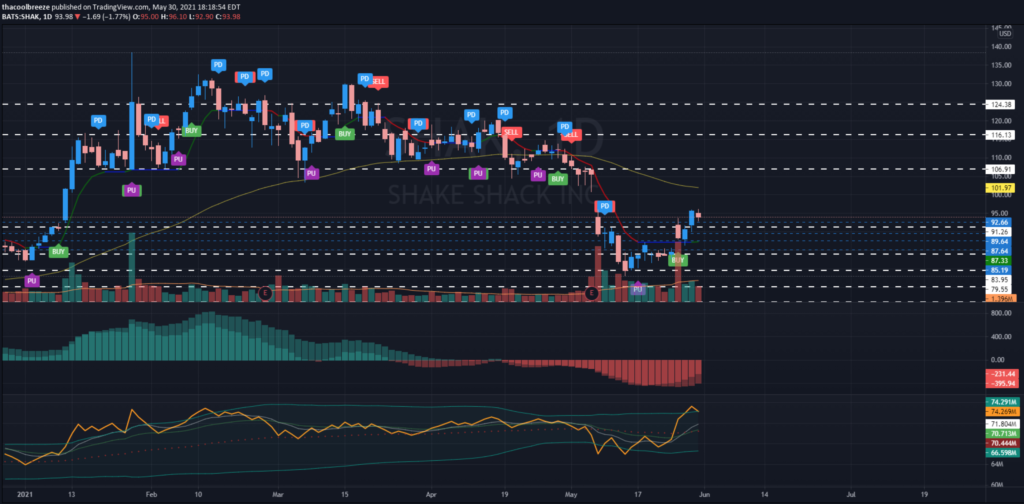
***Shake Shack (SHAK)***
Summary: Post earnings consolidation.Looking for a breakout and gap fill back to 106-107
- Long/Calls: A break and close above 95.67 with targets of 101.5, 107 (Major Resistance), 112, 116 (Major Resistance)
- Short/Puts: A break and close below 91.25 with targets of 89.4, 87.64, 85.19, 84 (Major Support), 79.5 (Major Support
- Also look for a potential bounce/reversal off 91.25 support level with Call Targets mentioned above.
- Consolidation between 91.25 & 107 or 84 & 91.25
Indicators:
- EMA: Below 72 EMA & Recently broke above 4 Period Variable MA
- RNNR Spotter: Currently in a buy signal but look for any potential reversals from targets mentioned above
- RNNR Momentum: Curling Up and Buying pressure is present
- On Balance Volume w/ Bollinger Band & EMA: Currently outside of the upper Bollinger Band and pointing down. Watch for pause or reversal here
1D Chart: https://www.tradingview.com/x/ebt71g2v/

***Starbucks (SBUX)***
Summary: Looking for Continuation of the recent breakout from the 112 price level
- Long/Calls: A break and close above 114.35 with targets of 115 (Major Resistance), 116.21, 117.31
- Short/Puts: A break and close below 113.5 with targets of 113, 112 (Major Support), 111, 110 (Major Support)
- Also look for a potential bounce/reversal off 113 or 112 support level with Targets mentioned above.
- Consolidation between 112 & 115
Indicators:
- EMA: Above 72 EMA & Trending Up with the 4 Period Variable MA
- RNNR Spotter: Currently in a buy signal but look for any potential reversals from targets mentioned above
- RNNR Momentum: Curling Up and Buying pressure is present
- On Balance Volume w/ Bollinger Band & EMA: Above all the EMA’s and Pointing up
1D Chart: https://www.tradingview.com/x/kodKSsG4/
***PayPal (PYPL)***
Summary: Looking for a continuation of uptrend after the post earnings breakdown consolidation
- Long/Calls: A break and close above 262.39 with targets of 268.71, 274.55 (Major Resistance + ATH)
- Short/Puts: A break and close below 258.65 with targets of 254.75 (Major Support), 250.5, 246.28, 241.81
- Also look for a potential bounce or rejection off 262.39 or 254.75 levels with Targets mentioned above.
- Consolidation between 262.39 & 268.71 or 254.75 & 262.39
Indicators:
- EMA: Above 72 EMA & Trending Up with the 4 Period Variable MA
- RNNR Spotter: Currently in a buy signal but look for any potential reversals from targets mentioned above
- RNNR Momentum: Curling Up and Buying pressure is present but still somewhat neutral
- On Balance Volume w/ Bollinger Band & EMA: Above all the EMA’s and Pointing up
1D Chart: https://www.tradingview.com/x/Suqh2ALO/
***Rocket Mortgage (RKT)***
**Summary**: Post Earnings Consolidation. Recently test a major resistance area and was rejected. Let’s see the potential scenarios
- Long/Calls: A break and close above 18.68 with targets of 19.5, 20.34, 21, 21.69, 22.27, 22.8, 23.11 (Major Resistance)
- Short/Puts: A break and close below 17.5 with targets of 16.69, 15.5, 14.5
- Also look for a potential bounce or rejection off the 16.69 level with Targets mentioned above.
- Consolidation between 16.69 & 18.68 or 18.68 & 20.34
**Indicators**:
- EMA: Below 72 EMA & Sideways with the 4 Period Variable MA
- RNNR Spotter: Currently in a buy signal but look for any potential reversals from targets mentioned above and re-test of previous support
- RNNR Momentum: Curling Up and Buying pressure is present
- On Balance Volume w/ Bollinger Band & EMA: Below its 72 and 21 EMA and sitting on the 9 EMA. A break below the 9 EMA puts us in continued consolidation
1D Chart: https://www.tradingview.com/x/3HOhGtIV/
***Alibaba (BABA)***
**Summary**: Post Earnings Consolidation. Looking for breakout from consolidation or a breakdown to lower levels
- Long/Calls: A break and close above 215.27with targets of 222.75 (Major Resistance), 228.75, 233.6
- Short/Puts: A break and close below 212.75 with targets of 211, 208 (Major Support), 202.31, 195.85 (Major Support)
- Also look for a potential bounce or rejection off the 208 level with Targets mentioned above.
- Consolidation between 208 & 215 or 215 & 222
**Indicators**:
- EMA: Below 72 EMA & Sideways with the 4 Period Variable MA
- RNNR Spotter: Currently in a Potential Uptrend signal. Be on the lookout for a confirmed Buy signal if momentum picks up
- RNNR Momentum: Curling Up and Buying pressure is present
- On Balance Volume w/ Bollinger Band & EMA: Recently crossed above its 9 and 21 EMA. A break above its 72 EMA would provide solid conviction for an uptrend.
1D Chart: https://www.tradingview.com/x/EfyrraC1/
Disclaimer: These are just ideas and are NOT recommendations to buy or sell any particular stock(s). Do your own DD and chart analyst before investing your money.


